01
Research
Independent research that informs decisions.
What we do
Olivia Energy is a strategic energy advisory, research and sustainability consultancy, committed to accelerating the move to a cleaner, more secure and more inclusive energy future. We partner with governments, businesses, investors and development organisations on evidence-based solutions in energy transition, climate policy, ESG, sustainable infrastructure and the transformation of energy markets.
The price of solar modules, 1975 to 2024
US dollars per watt, constant 2025 prices, log scale
Solar modules now cost a fraction of what they did. Africa holds 60% of the world’s best solar resources, yet had less than 1% of the world’s installed solar capacity at the end of 2025.
Sources: Our World in Data, from IRENA (2025), Nemet (2009), and Farmer and Lafond (2016), CC BY 4.0; International Energy Agency, Africa Energy Outlook 2022; IRENA, Renewable Capacity Statistics 2026. Retrieved 2 October 2026.
| Year | World |
|---|---|
| 1975 | $132.38 |
| 1976 | $99.60 |
| 1977 | $72.66 |
| 1978 | $51.41 |
| 1979 | $43.20 |
| 1980 | $36.60 |
| 1981 | $29.27 |
| 1982 | $26.30 |
| 1983 | $21.23 |
| 1984 | $19.73 |
| 1985 | $17.22 |
| 1986 | $14.24 |
| 1987 | $12.11 |
| 1988 | $11.31 |
| 1989 | $11.69 |
| 1990 | $12.09 |
| 1991 | $11.20 |
| 1992 | $10.44 |
| 1993 | $9.76 |
| 1994 | $9.23 |
| 1995 | $8.54 |
| 1996 | $7.98 |
| 1997 | $7.95 |
| 1998 | $7.17 |
| 1999 | $6.62 |
| 2000 | $6.50 |
| 2001 | $6.28 |
| 2002 | $5.75 |
| 2003 | $5.46 |
| 2004 | $4.70 |
| 2005 | $4.75 |
| 2006 | $5.17 |
| 2007 | $5.21 |
| 2008 | $4.75 |
| 2009 | $3.17 |
| 2010 | $2.51 |
| 2011 | $2.06 |
| 2012 | $1.11 |
| 2013 | $0.86 |
| 2014 | $0.79 |
| 2015 | $0.74 |
| 2016 | $0.68 |
| 2017 | $0.57 |
| 2018 | $0.51 |
| 2019 | $0.47 |
| 2020 | $0.37 |
| 2021 | $0.33 |
| 2022 | $0.37 |
| 2023 | $0.32 |
| 2024 | $0.27 |
01 / 06
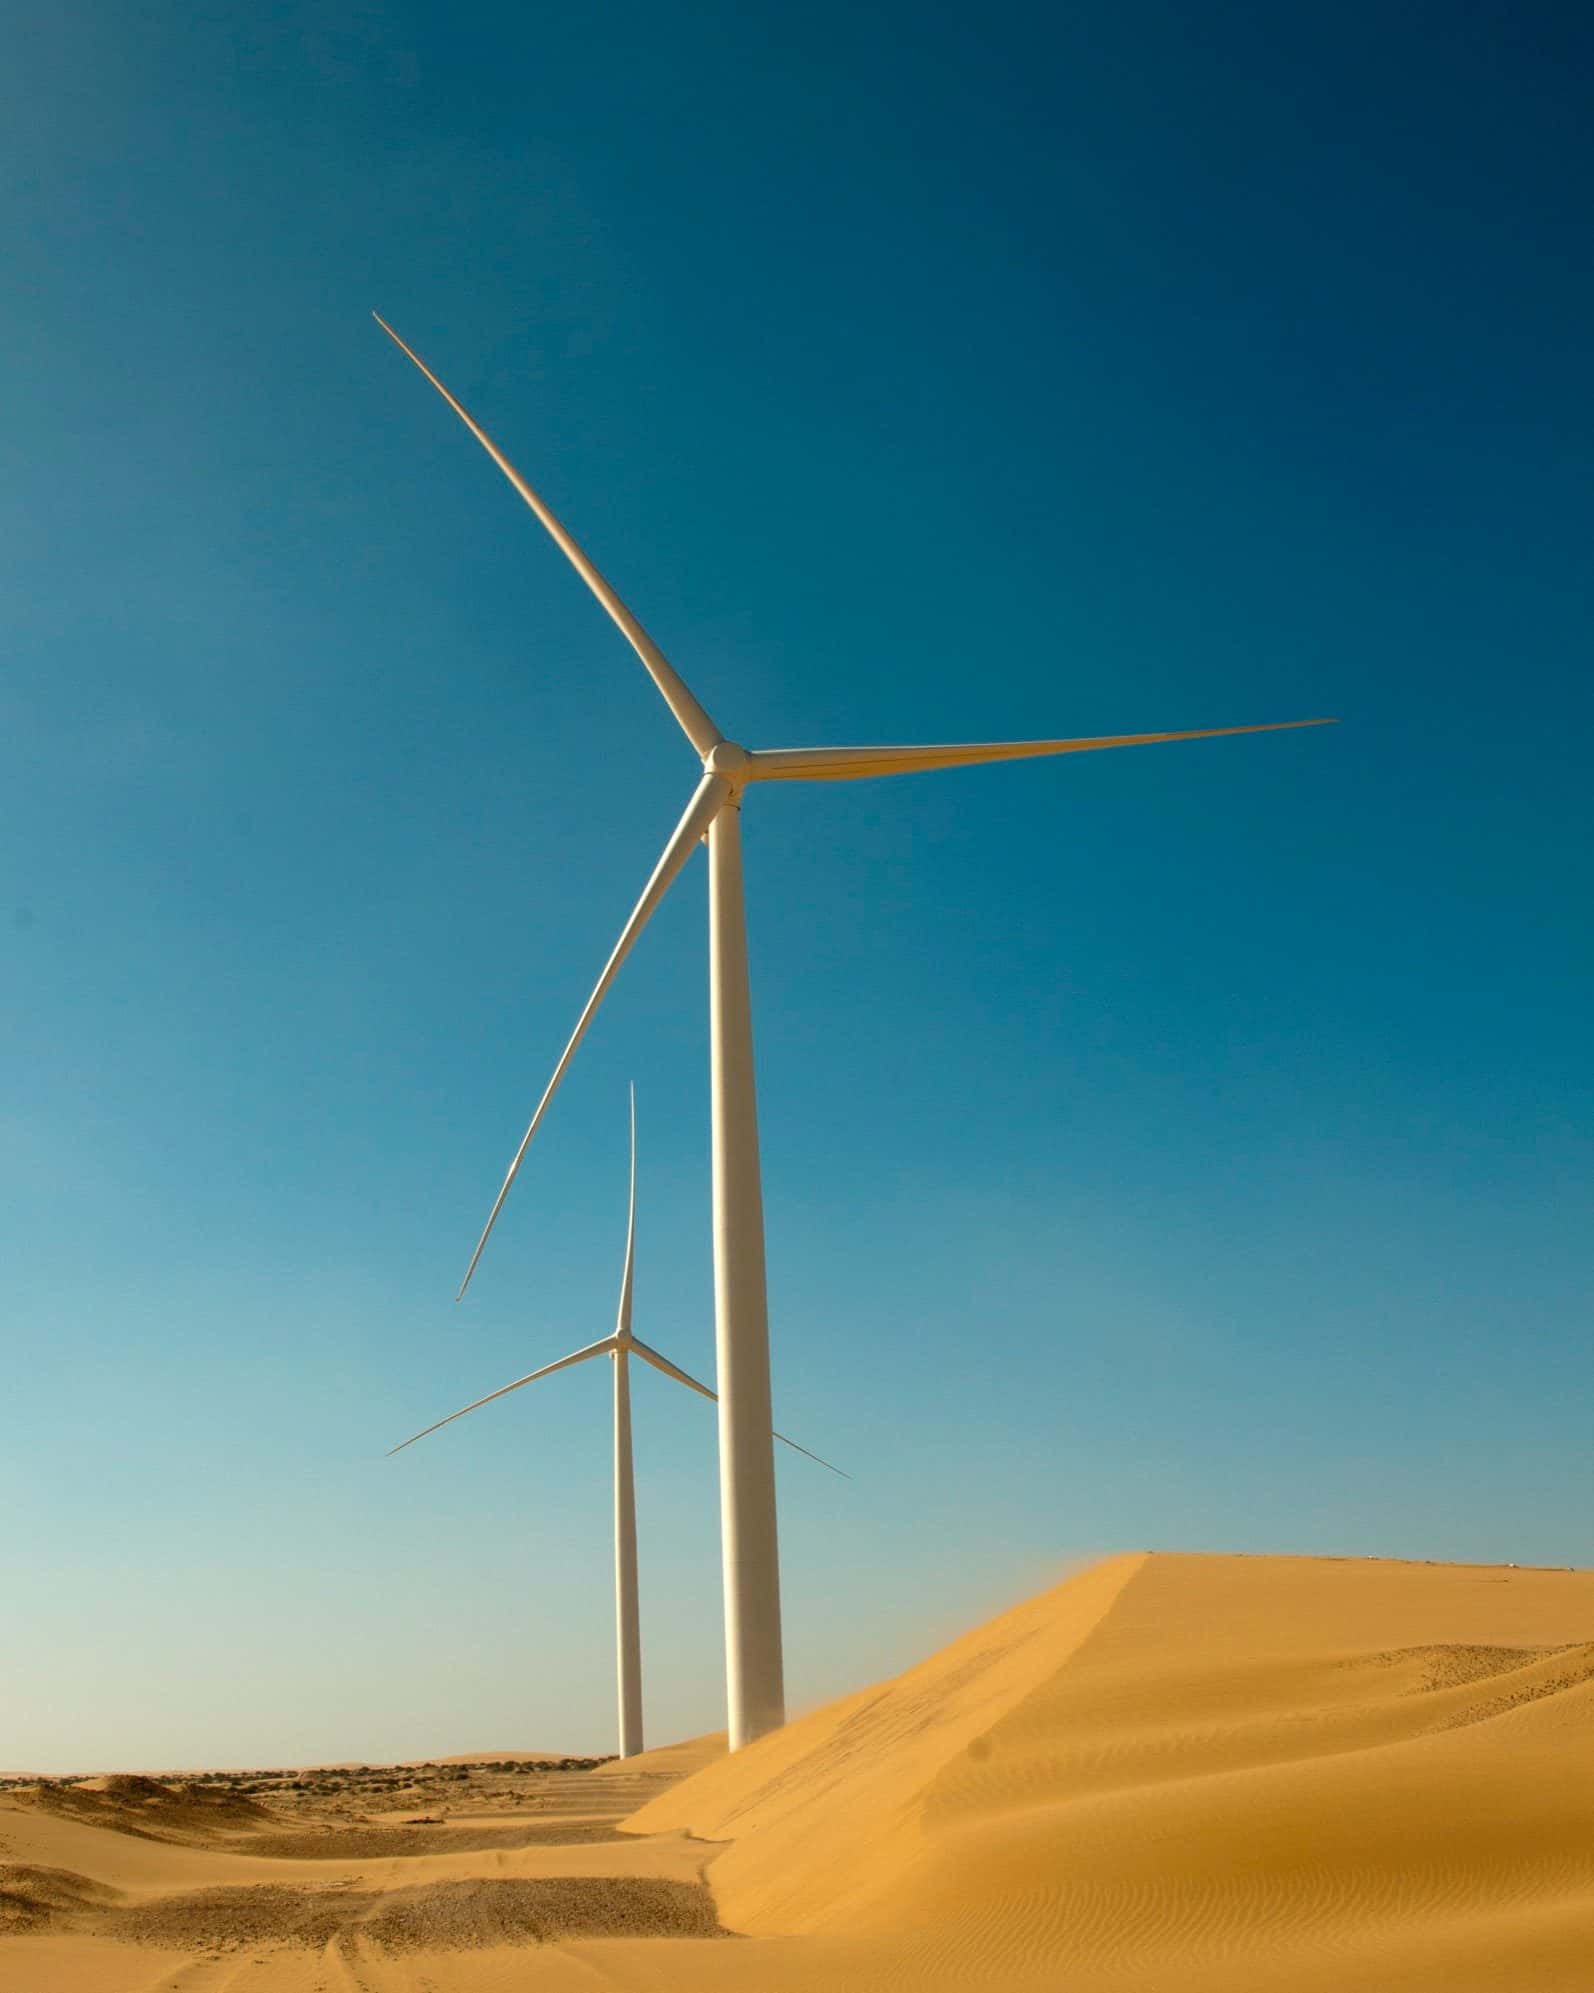
Innovation accelerates progress.
We help organisations set net-zero strategies and turn them into decarbonisation roadmaps and transition plans that integrate renewables and build climate resilience.
of installed power capacity by 2060 is the target in Nigeria’s updated Energy Transition Plan, with electricity generation rising 6.5 times from 2020.
Source: Nigeria Energy Transition Plan, 2024 update, hosted by Sustainable Energy for All. Retrieved 2 October 2026.
02 / 06
Policy shapes markets.
We analyse energy markets, advise on regulation and tariffs, and measure the economic impact of policy, so that decisions rest on evidence.

01 Installed
Nigeria’s 28 grid-connected power plants have 13,625 MW of installed capacity. Each square is 100 MW.
02 Available
On average in the quarter, less than a third of it could run: a plant availability factor of 32.7%.
03 Delivered
That is what the grid actually generated, on average, each hour of the quarter: 8,883 GWh in total. The red squares were available but not generated.
Installed is not delivered: Nigeria’s grid, first quarter of 2026
Squares are rounded to the nearest 100 MW.

Lekki-Ikoyi Link Bridge, Lagos. Photo: Opeyemi Adisa, Unsplash
Source: Nigerian Electricity Regulatory Commission, Quarterly Report, first quarter 2026. Retrieved 2 October 2026.
03 / 06
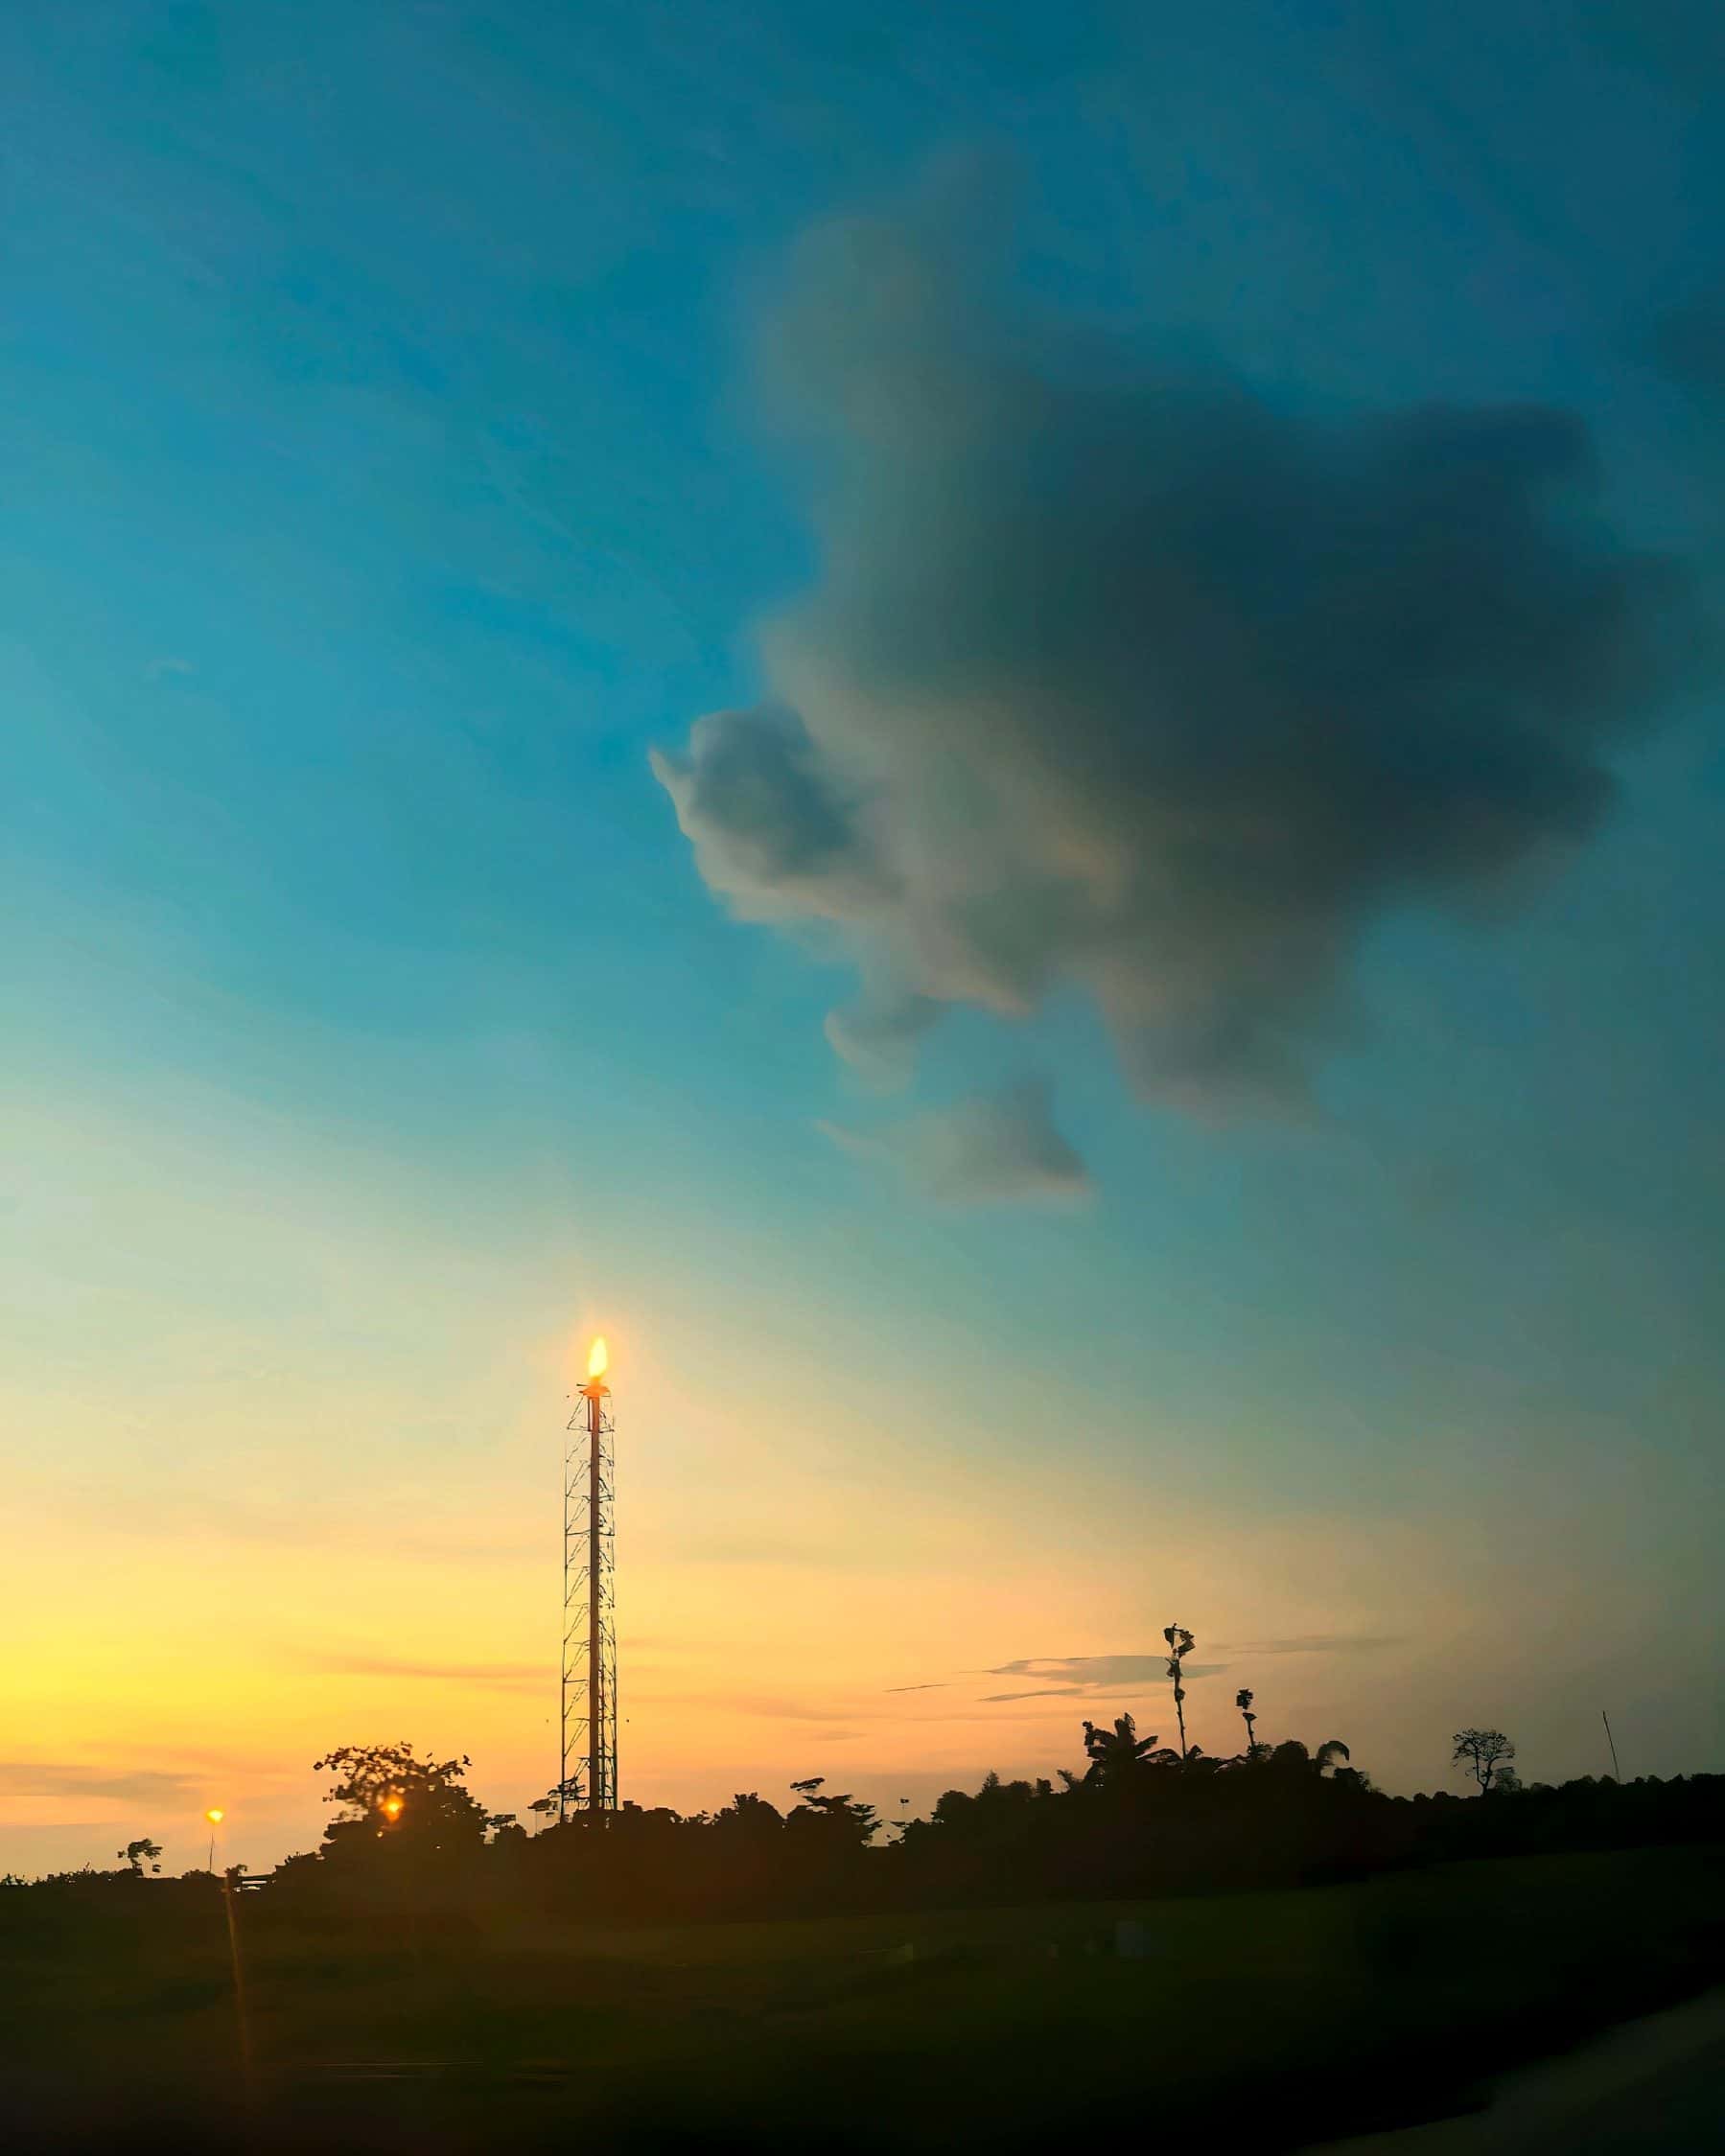
Growth, environmental protection and social impact, in balance.
We help organisations set an ESG strategy, report against it with confidence and manage their carbon.
of global gas flaring in 2025 came from nine countries, Nigeria among them, which together produced 46% of the world’s oil.
Source: World Bank, Global Gas Flaring Tracker Report, June 2026. Retrieved 2 October 2026.
04 / 06

Knowledge drives transformation.
We turn data into decisions: market intelligence, industry reports, feasibility studies and scenario models built for the question at hand.
of electricity was generated per person in Nigeria in 2025, against a world average of 3,860 kWh.
Source: Our World in Data, from Ember (2026), CC BY 4.0. Retrieved 2 October 2026.
05 / 06

Training that bridges industry, academia and public policy.
We design executive training, workshops and seminars that build the skills the energy transition needs, for leaders in government and industry.
people will live in sub-Saharan Africa by 2054, after 79% growth in thirty years, on United Nations projections.
Source: United Nations, World Population Prospects 2024. Retrieved 2 October 2026.
06 / 06
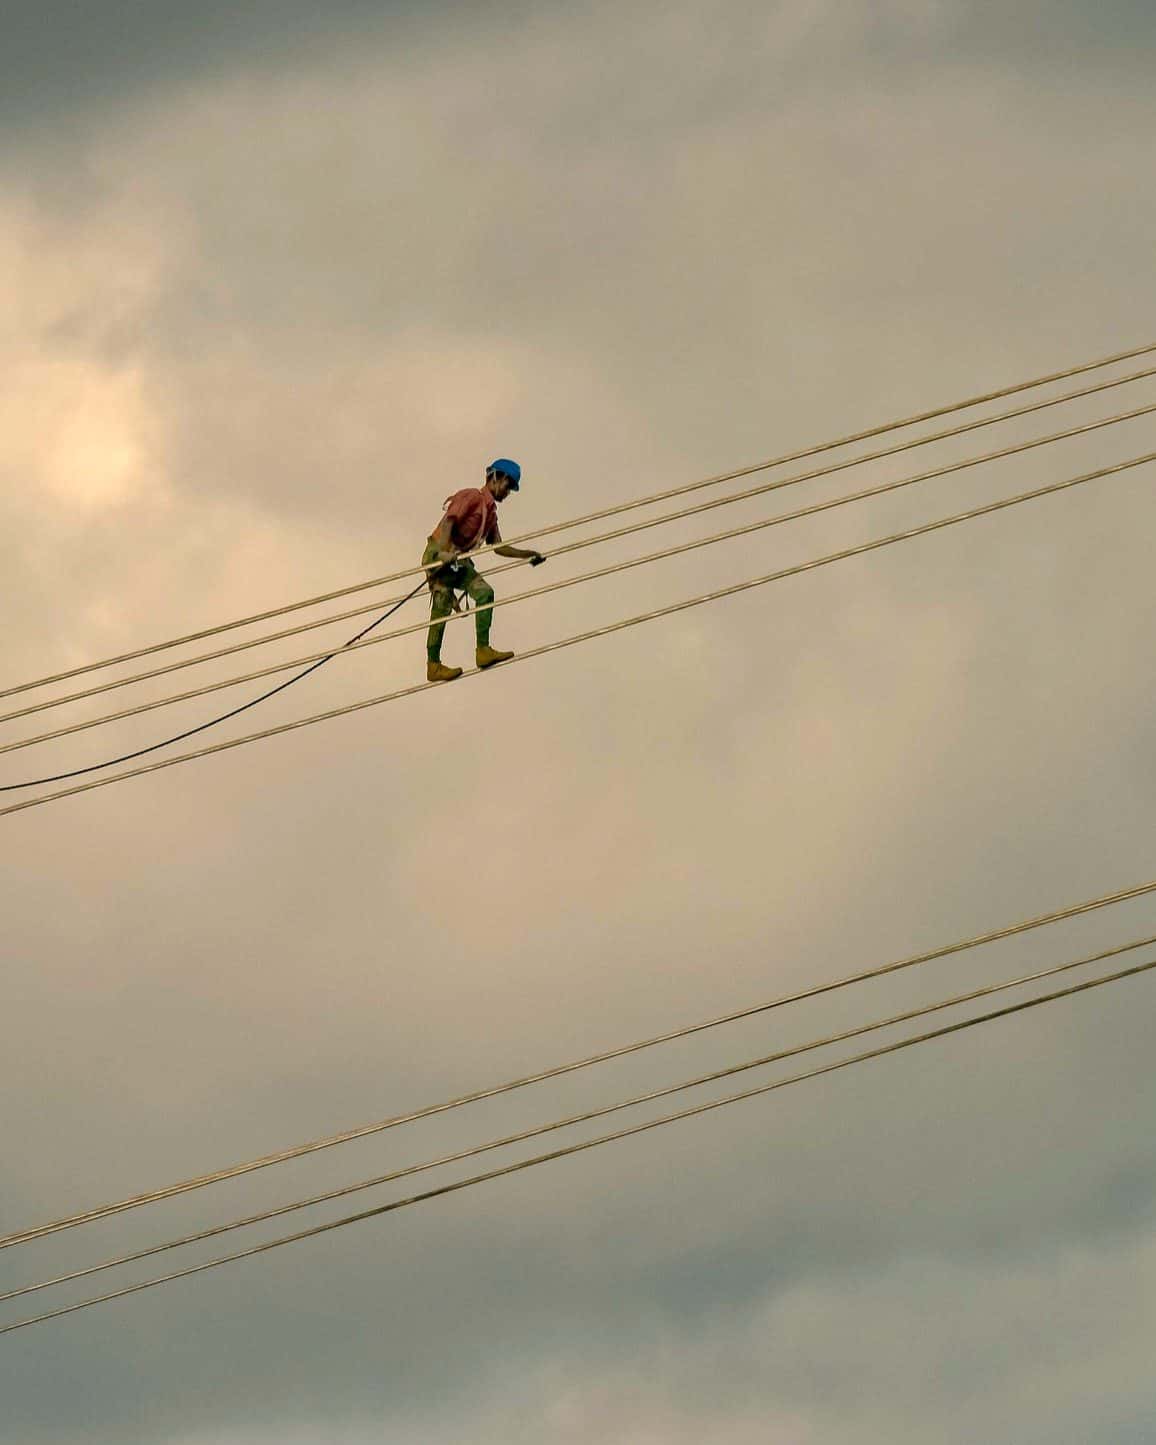
Disciplined execution, from first plan to final evaluation.
We bring project and programme management discipline to energy projects, with stakeholder engagement, risk management, and monitoring and evaluation.
Debt service costs equalled more than 85% of Africa’s total energy investment in 2025, and that investment was a third lower than in 2015 (IEA estimates).
Source: International Energy Agency, World Energy Investment 2025. Retrieved 2 October 2026.
What makes us different
Deep industry expertise across conventional and renewable energy.
Evidence-based research and economic analysis.
Practical policy advice informed by real-world operations.
Experience across government, industry, academia and the non-profit sector.
A global perspective with a strong understanding of African energy markets.
A commitment to sustainable development and energy equity.
How we work
Independent research that informs decisions.
Strategic advice for governments and businesses.
Helping organisations navigate energy transformation.
Creating measurable social, economic and environmental value.
Who we serve
Our advice is built for four kinds of institution, from energy ministries and regulators to investors, development partners and research institutes.
01
02
03
04